Contents
GENEActiv Workflow
Hodgkin Huxley model
Muscle Twitch Simulation
Below are three examples of my previous work: creating a GENEActiv workflow, simulating neurons with the Hodgkin Huxley model, and simulating a muscle twitch. The first project has been part of my work at Rush University while the latter two come from class work as part of my Master’s degree at Illinois Institute of Technology.
GENEActiv Workflow (Rush University)
The GENEActiv workflow has been my largest contribution at Rush. GENEActivs are a wrist worn device that record a high time resolution accelerometer signal along with skin temperature and light intensity. The GENEActivs are used as a modern replacement for a previous activity monitor, an actical, to provide additional information. Actical used an accelerometer as well but to save limited storage space the signal was processed in real-time to a new “counts” signal intended to summarize the wearer’s activity levels over the last 15 seconds. As such the first task was to imitate the actical’s signal to allow GENEActiv data to contribute to the actical data set.
After successfully converting the GENEActiv signal to counts, incoming files needed to be processed and summarized to start the inflow of new data. Processing includes quality control, converting to counts, calculating actical’s variables and, to make use of the additional information in the GENEActiv signals, calculating new variables from the raw accelerometer signal.

When GENEActiv files come in they can include periods at the end of their signal after the device was removed from the participant. To remove these segments and times when the participant removed the device, files are manually check with a quality control GUI (Figure 1). A user selects the days at the bottom corresponding to periods of non-wear. To assist the process, the GUI searches for these windows with a linear decision line using the number of times the acceleration signal crossed zero and the standard deviation in skin temperature over the day. In Figure 1 above the shaded red area indicates a day that should likely be removed.
With the signals cleaned, they are sent down two paths. The first goes on to mimic it’s predecessor and the second to add new variables. These new variables include time walking and the in progress sleep detection.

Figure 2 shows the detection of walking periods. On the top are steps found with GENEActiv’s signal using a method of correlating the signal with a frequency varying complex wave. The step tracker signal below contains the true step locations from a device designed to fire when pressure is applied to a sensor on the bottom of the foot. Despite the over-prediction of steps by the GENEActiv algorithm during non-walking periods, when searching for windows with a high concentration of steps (indicated by the black lines below the accelerometer data) the calculated time walking matches the true (step tracker) data closely.
Hodgkin Huxley model (Illinois Tech)
My favorite project from school was using the Hodgkin Huxley model to simulate neurons and show some of their characteristics The MATLAB code I wrote for simulating the Hodgkin Huxley neurons and generating the figures. (Note: the figures here have been modified to better match the site theme) . Inspired by Eugene M. Izhikevich’s book Dynamical Systems in Neuroscience and György Buzsáki’s Rhythms of the Brain, the simulation was used to show refractory periods, the change in firing threshold based on the neuron’s state, how rhythms occur, and a simple and meaningless network of neurons continuously stimulated each other was created by connecting 50 simulated neurons.
Action potentials are the result of charged ions (such as Na+ K+) moving in and out of a neuron, changing it’s membrane potential. Neurons actively drive Na+ ions out of the cell and K+ into the cell, past their equilibrium concentrations. As a result, if the ions are allowed to flow freely they will move back towards equilibrium, down the electrochemical gradient, leading to a net change in membrane potential. As a relative measure (charge outside the cell relative to inside of the cell), the membrane potential is dependent on a reference point that can be set to any value. For simplicity Hodgkin and Huxley chose mV to be the membrane potential of a neuron at rest.
Voltage-gated channels prevent the ions from returning to equilibrium during rest; however positive changes in the membrane potential can open the gates causing a spike in potential that will in turn open channels down the neuron, propagating the potential change along the neuron’s axon.
Three types of ion channels are considered in Hodgkin and Huxley’s model: Na+, K+, and leak channels. The former two being voltage gated while the leak channels are always open allowing a limited flow of ions and other charged particles through the cell’s membrane. In practice voltage-gated channels don’t open at exactly the same threshold potential, instead there is a distribution of thresholds. At a given membrane potential a randomly chosen gate has some probability of being open. Due to the large number of channels in a cell the probability of an individual gate being open should approximately be the fraction of that type of ion channel currently active. In Hodgkin-Huxley notation, n is the probability of activation for K+ channels, m is that for Na+ channels, and h is the Na+ channel’s probability of inactivation. To prevent action potentials from moving backwards and give time for the cell to rebuild its electrochemical gradients the Na+ channels become inactive immediately after they close. Confusingly, the probability of inactivation is one minus the probability that the channel is inactivated (i.e. a value near means channels are likely inactive).

Figure 3 shows an action potential (top) and the cell’s activation probabilities during the spike (bottom). The Na+ channels respond earlier than the K+ channels—m increases quicker than n. This allows Na+ ions to flow into the cell, increasing the membrane potential, due to the positive charges moving inside the cell, before K+ ions start leaving, corresponding to the initial spike in membrane potential. Once more of the K+ channels start to open the potential drops back down to zero (and even a little below). At around the same time, Na+ channels go into inactivation.

While the cell’s activation potentials are returning to normal the cell is less susceptible to spiking. During this recovery phase the cell is said to be in it’s refractory period. In Figure 4 a cell is excited with two currents of identical magnitudes. The first one confirms that the stimulus is strong enough to start an action potential but the second one is unable to produce the same response. However, if the second stimulus is sent a little later, as in Figure 5 the cell does spike.

While the second spike in Figure 4 was not able to start an action potential, Figure 3 shows at ms post spike the activation probabilities are already nearing their values at rest. Notably the inactivation probability is moving upwards indicating that many of the Na+ channels are capable of activating. This suggests that a larger stimulus, such as the continuous current in Figure 6 should be able to cause an action potential in spite of the cell being in its refractory period, and the figure that is in fact the case.

The cell in Figure 6 fires repeatedly so long as a strong enough stimulus is provided. Unlike a muscle cell Figure 9, the Neuron does not go into tetanus (constant firing) instead each action potential is separate. This is due to the Na+ channels becoming temporarily inactive following a spike. Until enough channels leave the inactive state no stimulus will be able to cause an action potential. The refractory period should then be further broken down into: absolute refractory—the time when too many Na+ channels are inactive for the neuron to spike, and relative refractory—when the cell is still recovering but can be excited with a large enough stimulus. As a consequence of a repeatable absolute refractory period, a neuron under continuous stimulation (as in Figure 6) will spike at a constant frequency enabling rhythms to be produced in the brain. Additionally, neurons with similar dynamics (i.e. those whose refactory period’s have similar duration) can become linked. If a strong stimulation excites a group of neurons the neurons with similar dynamics will be inactive and then ready to fire again at the same time leading to potential synchronization.


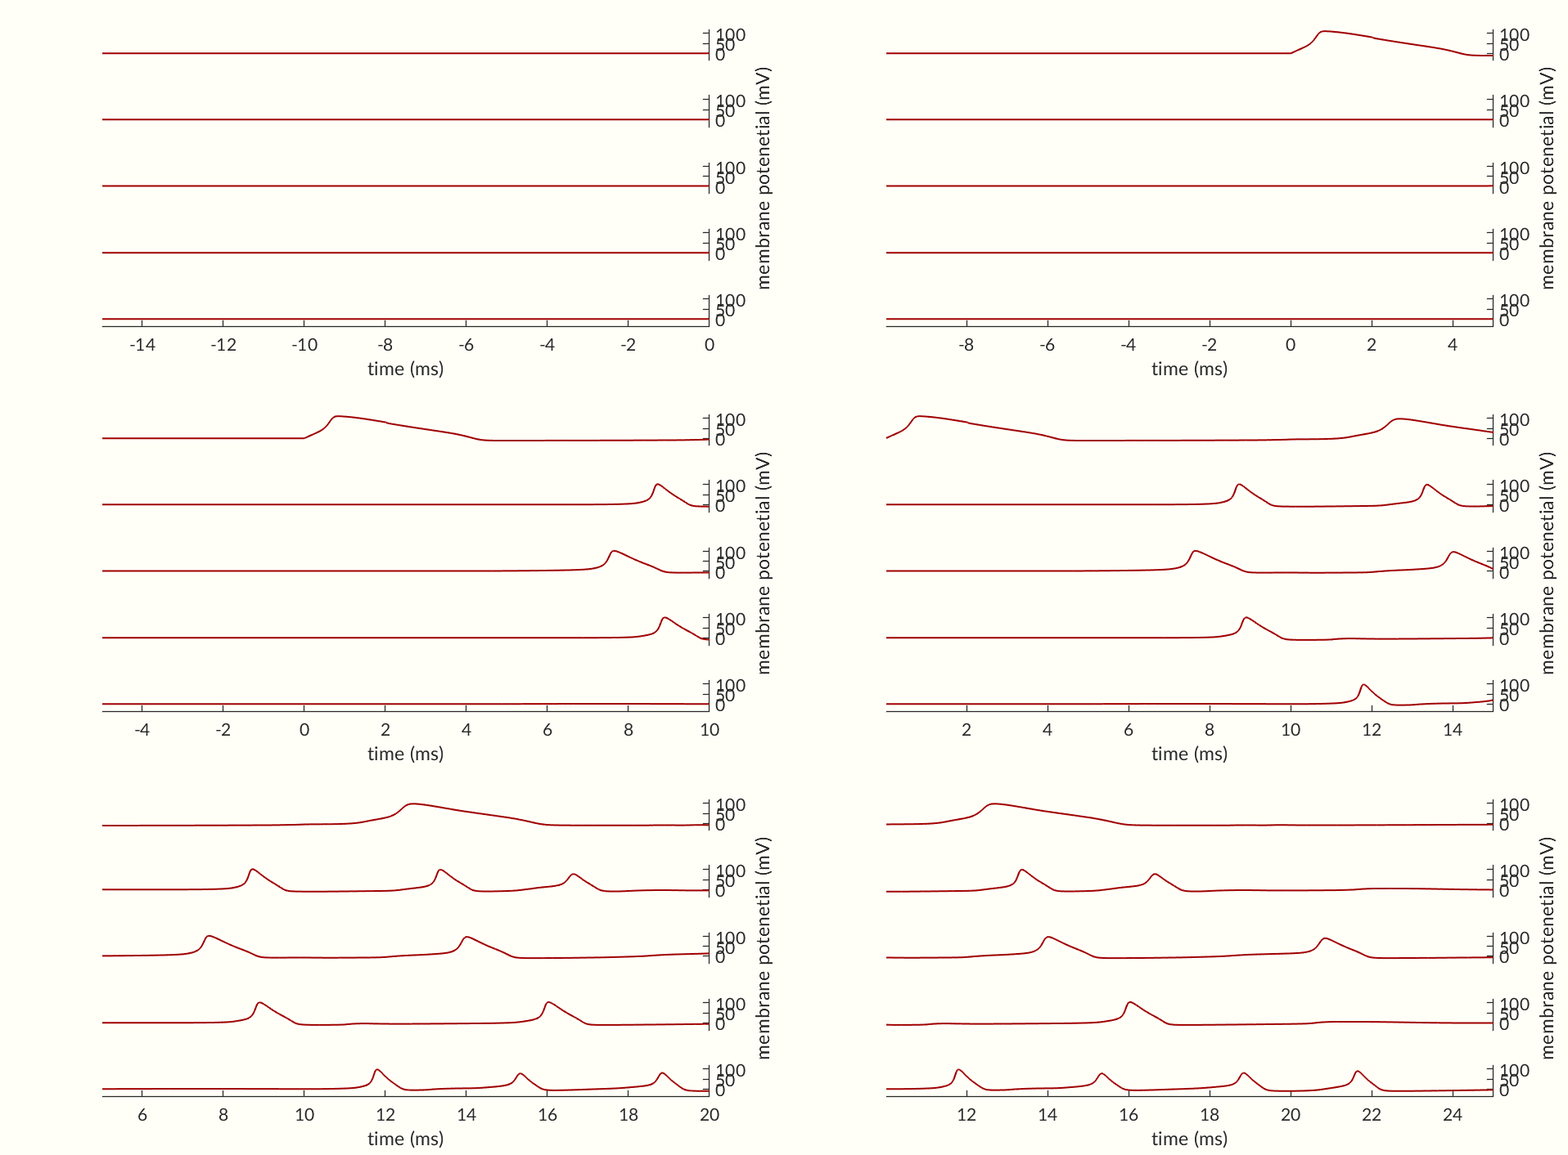
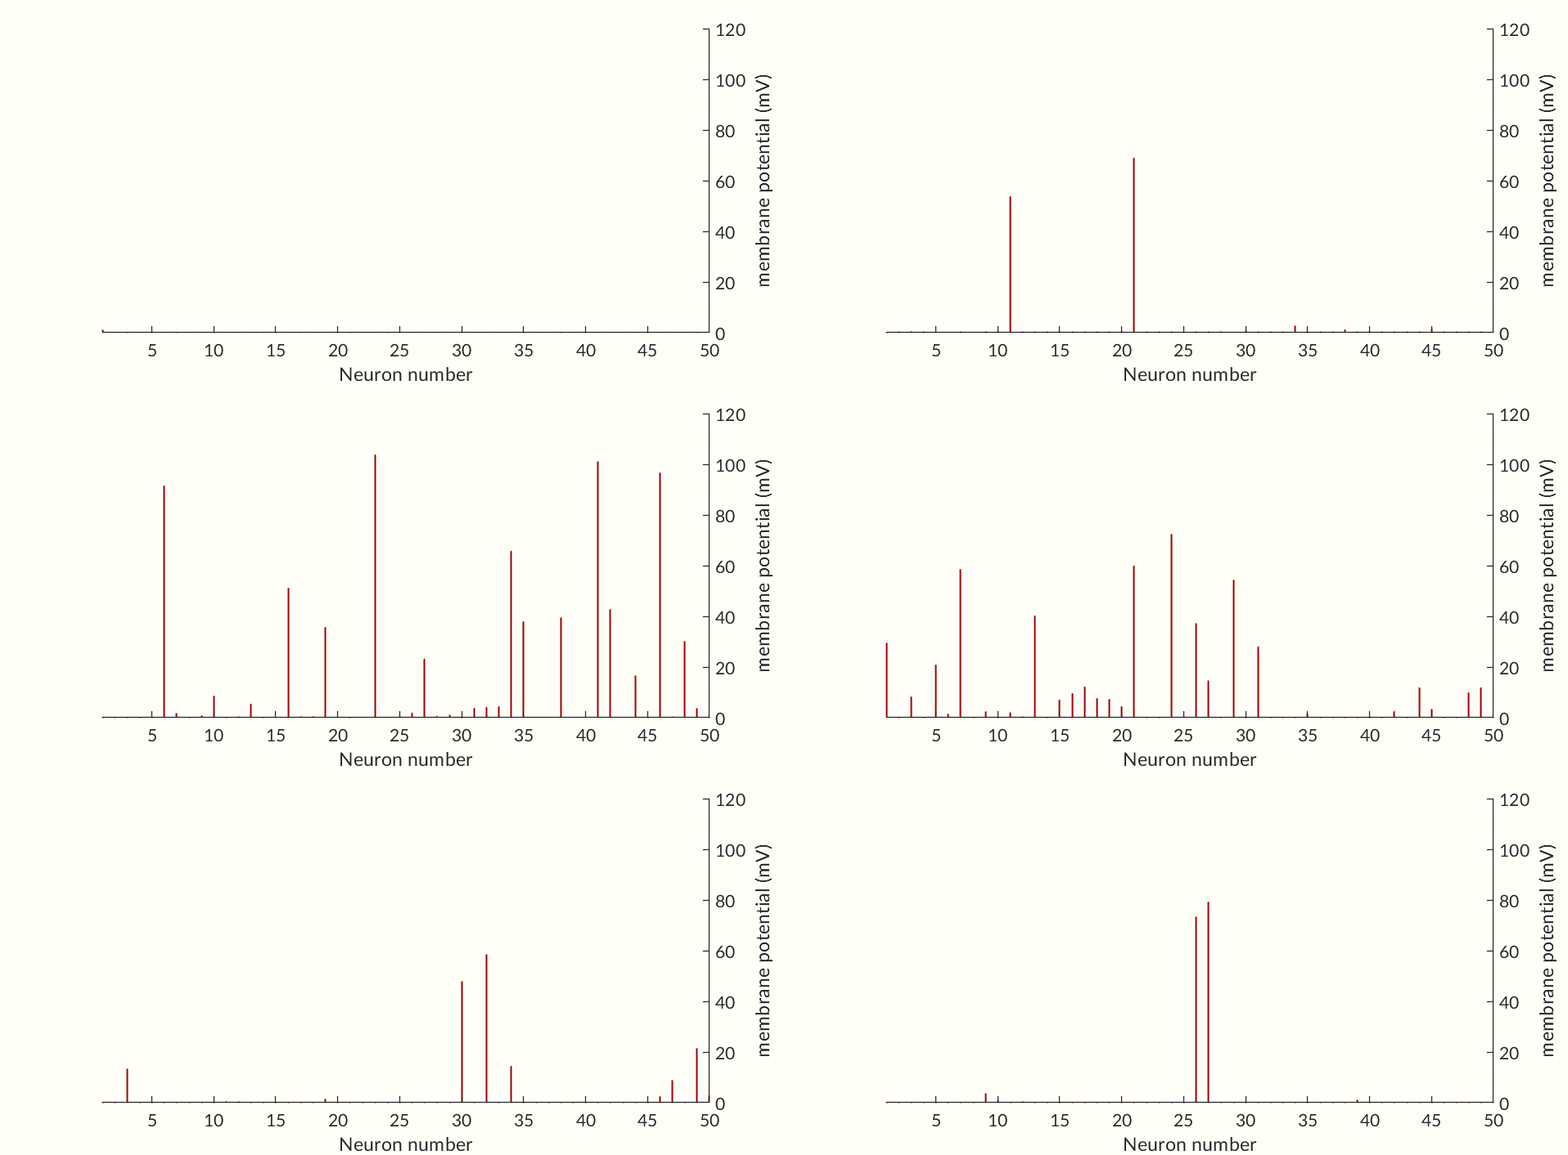
The final two figures (Figures 7 and 8) of the section show a small network of 50 simulated neurons. (If you don’t scroll down so both figures are initially visible at the same time the gifs may not start together.) Each of the neuron’s time constants (what determines the response times of the activation probabilities and consequently the duration of an action potential and the following refractory periods) were randomly generated via a normal distribution to add some variance in the neurons. Secondly, the connection weights between neurons were also randomly generated and randomly pruned (i.e. weights were set to zero at random). The parameters were chosen simply to keep the network stimulating itself indefinitely while not going into a seizure. The network is set off by an initial stimulation to neuron 1 from there it is maintained entirely by neurons stimulating each other. Obviously an extreme oversimplification of a real brain but still a fun simulation. I would like to see if I can get some synchronization between neurons but so far have been unable to. Each neuron likely needs to have one of a small set of time constants rather than completely random constants. Also there needs to be a way to ensure enough like neurons are being connected without over-connecting the network.
Muscle Twitch Simulation (Illinois Tech)

Based on the paper by Kesar T. et al, Predicting Muscle Forces of Individuals with hemiparesis following stroke, Figure 9 simulates the contraction of a muscle in response to an impulse train. Taking advantage of the summative properties of muscle contraction the solution to the response of the entire train of impulses can be simplified to the sum of the solution to a single impulse copied and time-shifted for each identical impulse. This significantly reduces the computation time of the ordinary differential equation (ODE) solver, the slowest part of the simulation. Additionally, many of the parameters that can be changed in the GUI do not affect the muscle’s impulse response preventing the need to resolve the ODE, making the new simulation appear nearly instantaneous.